Directional Charts
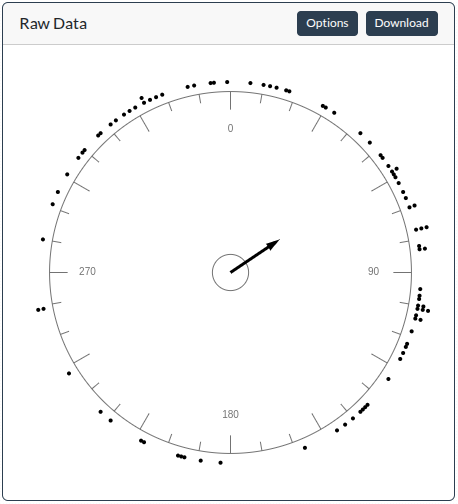
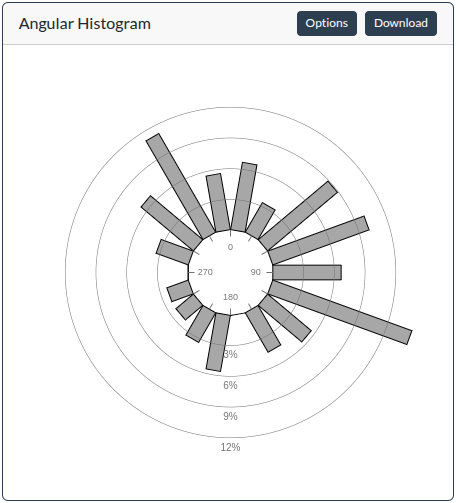
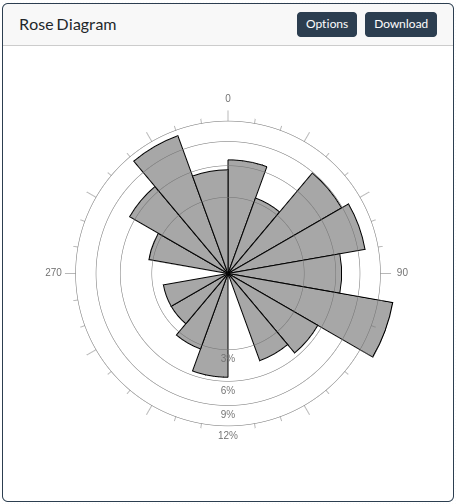
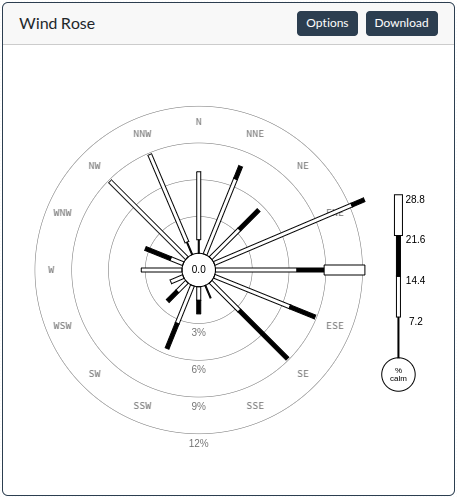
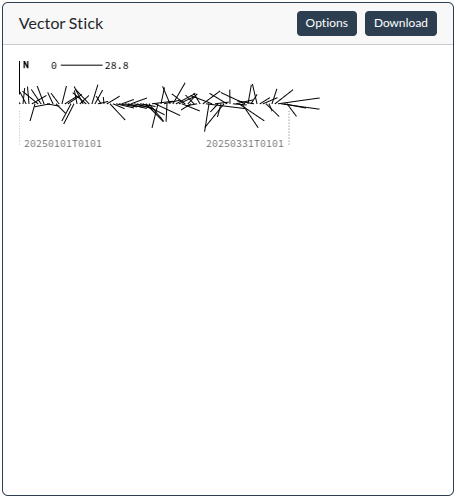
Directional Charts is a web-based tool for analyzing and visualizing directional (circular) data. Users can upload datasets in CSV or TXT format to generate five standardized plot types: raw data, angular histograms, rose diagrams, wind roses, and vector stick plots. Access the tool at: Directional Charts .